Financial Information
| RMB million | 2023 | 2022 | Change |
|---|---|---|---|
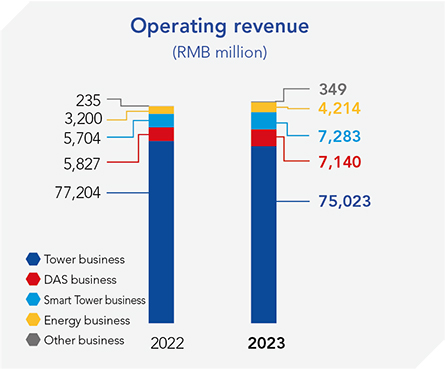
| Operating revenue | 94,009 | 92,170 | 2.0% |
| of which | |||
| Tower business | 75,023 | 77,204 | -2.8% |
| DAS business | 7,140 | 5,827 | 22.5% |
| Smart Tower business | 7,283 | 5,704 | 27.7% |
| Energy business | 4,214 | 3,200 | 31.7% |
| Operating profit | 14,502 | 13,312 | 8.9% |
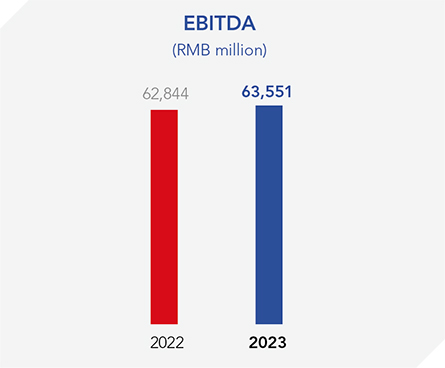
| EBITDA 1 | 63,551 | 62,844 | 1.1% |
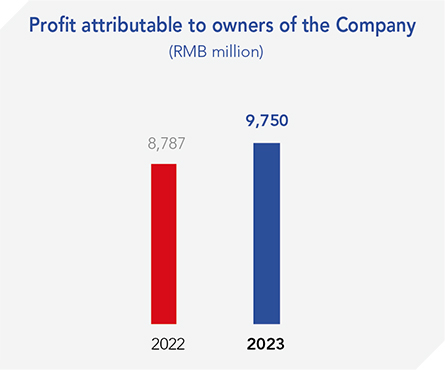
| Profit attributable to owners of the Company | 9,750 | 8,787 | 11.0% |
| Capital expenditure | 31,715 | 26,207 | 21.0% |
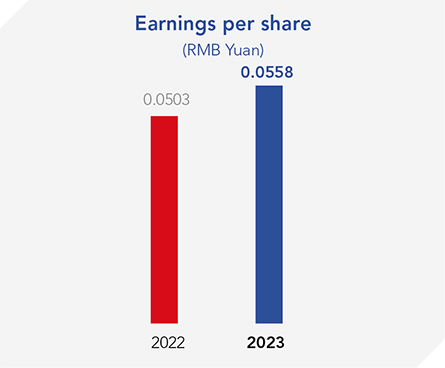
| Basic earnings per share (RMB Yuan) | 0.0558 | 0.0503 | 10.9% |
Note 1: EBITDA is calculated by operating profit plus depreciation and amortization.